1. Overview
Baosky IDE is the first domestic cloud-native development platform for large-scale PLCs. It is independent of the operating system and can be used outside of the Microsoft ecosystem and adapts to the national domestic ecosystem. The open nature of Baosky IDE can support third-party development of custom programs to be seamlessly integrated into the Baosky IDE platform and establish its own product chain and ecosystem.
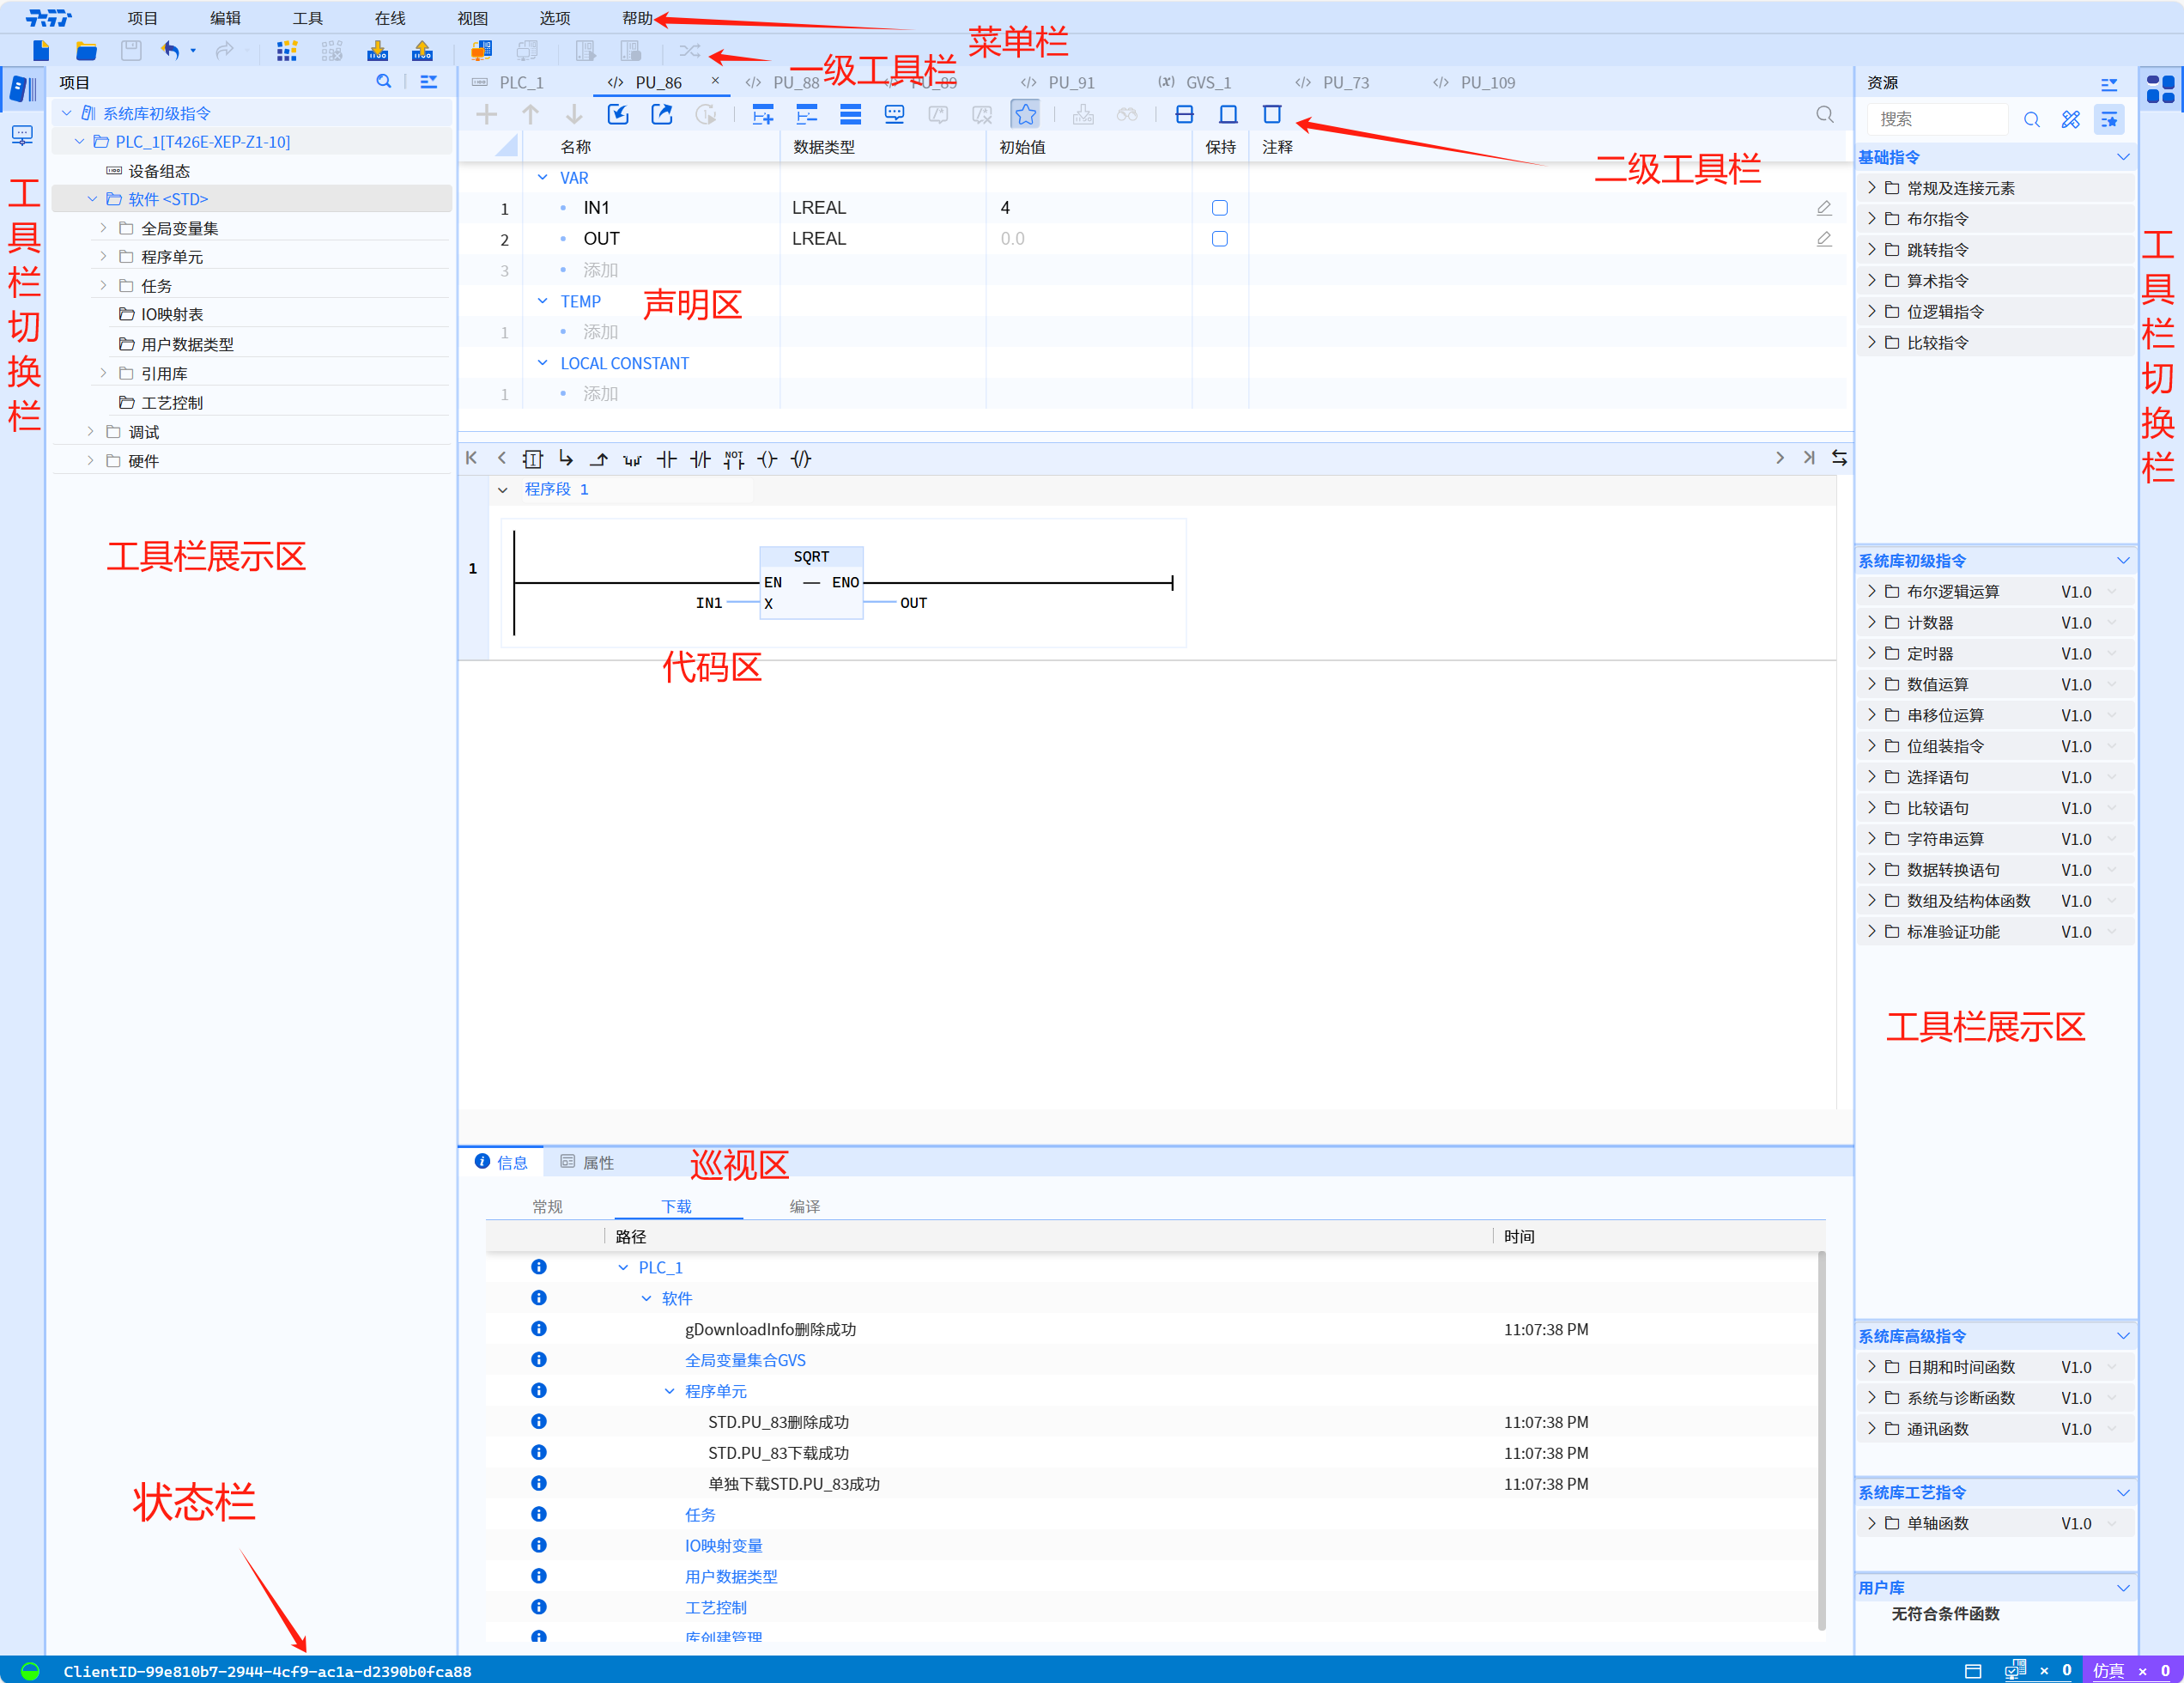
The overall framework of the Baosky IDE page is divided into:
- Above: menu bar and toolbar
- Left: Tool switching bar and toolbar display area
- Right side: Tool switching bar and toolbar display area
- Below: Inspection window and status bar
- The middle is the working area
1.1 Overall UI introduction
1.1.1 Screenshot of page display
1.1.2 Toolbar display area
This section takes the content displayed by default as an example, that is, the project tree (left toolbar). The root directory of the project tree is divided into device configuration shortcut operations, software directory, debugging directory and hardware directory.
-
Software directory:
-
Global variable set: configure global variable points and grouping functions
-
Program unit: configuration program PRG, function block FB, function FC
-
Task: Configure continuous cycle tasks, periodic cycle tasks, event tasks
-
IO mapping table
-
User data type
-
Reference library: Drag and drop from the system library or user library to be referenced or the program will automatically be referenced
-
Process control: add axis objects
-
-
Debug directory:
- Online and diagnostics: diagnostic buffer, UMAC, setup time, firmware update, user program reset, load and monitoring
- Task monitoring: monitor all task-related parameters
- Monitoring table: Monitor required variables
-
Hardware directory:
- Local configuration: properties can be modified according to the selected device
- Remote configuration: add required master station, slave station and related IO modules, and modify the attribute values
1.1.3 Work area
The work area is a unified window for engineers to perform variable editing, software programming, task management, IO mapping table editing, reference library management, user data type editing, as well as the implementation of online diagnostic functions, monitoring table monitoring, task monitoring, and hardware configuration.
1.1.4 Tour window
The inspection window is the attribute output window, general output window, compilation and download output window, and the output window of the hardware channel table and IO conflict table.
1.1.5 Toolbar display area
The toolbar display area shows system functions when the working area is software, from which users can drag and drop system or user functions into the middle working area for editing; when the working area is hardware, it shows hardware information, and users can drag and drop hardware from this hardware pool into the working area for management.
1.2 Introduction to UI buttons
1.2.1 Introduction to the interface buttons in the toolbar area
-
The toolbar icon is located in the UI interface location as shown below
-
Toolbar is mainly to facilitate the user can directly and instantly use the most common commands. toolbar is fast, convenient, and efficient
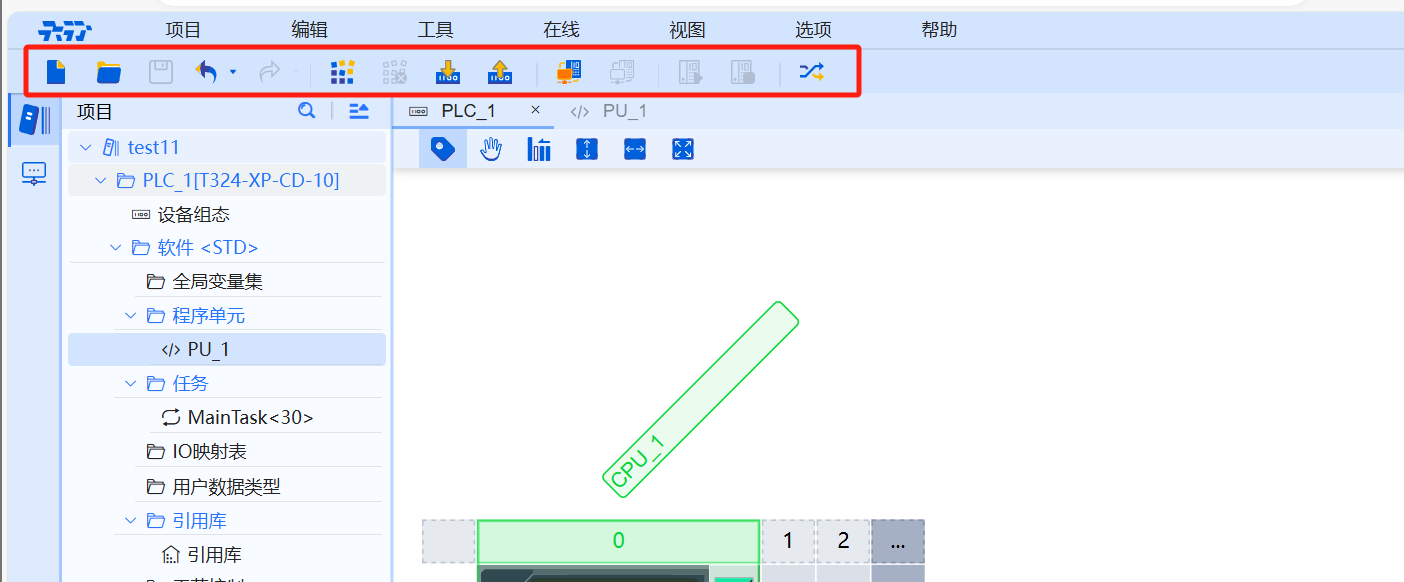
- The functions of each button are introduced in the following table
| Function | Icon | Function | Remarks |
|---|
|Compile|  | Compile function| First click: Compile all software and hardware
After modification second click: software incremental compilation, hardware full compilation |
|Cancel|  |Cancel compilation|
|Download to device|
|Cancel compilation|
|Download to device|  |Download the current program to the device| Full hardware, software download and execute in increments |
|Upload from device|
|Download the current program to the device| Full hardware, software download and execute in increments |
|Upload from device|  | All blocks can be loaded into the project, or only the software part can be loaded to project |
|Online|
| All blocks can be loaded into the project, or only the software part can be loaded to project |
|Online|  | Specify the connection path when establishing a connection for the first time |
|Offline|
| Specify the connection path when establishing a connection for the first time |
|Offline|  | Terminate existing online connection |
|Start PLC|
| Terminate existing online connection |
|Start PLC|  | Start PLC |
|Stop PLC|
| Start PLC |
|Stop PLC|  | Stop PLC |
|Cross reference|
| Stop PLC |
|Cross reference|  | View interdependencies, interrelationships, and the location of each object.|
1.2.2 Introduction to work area interface buttons
- The location of the UI screen where the work area icon is located is shown in the following figure
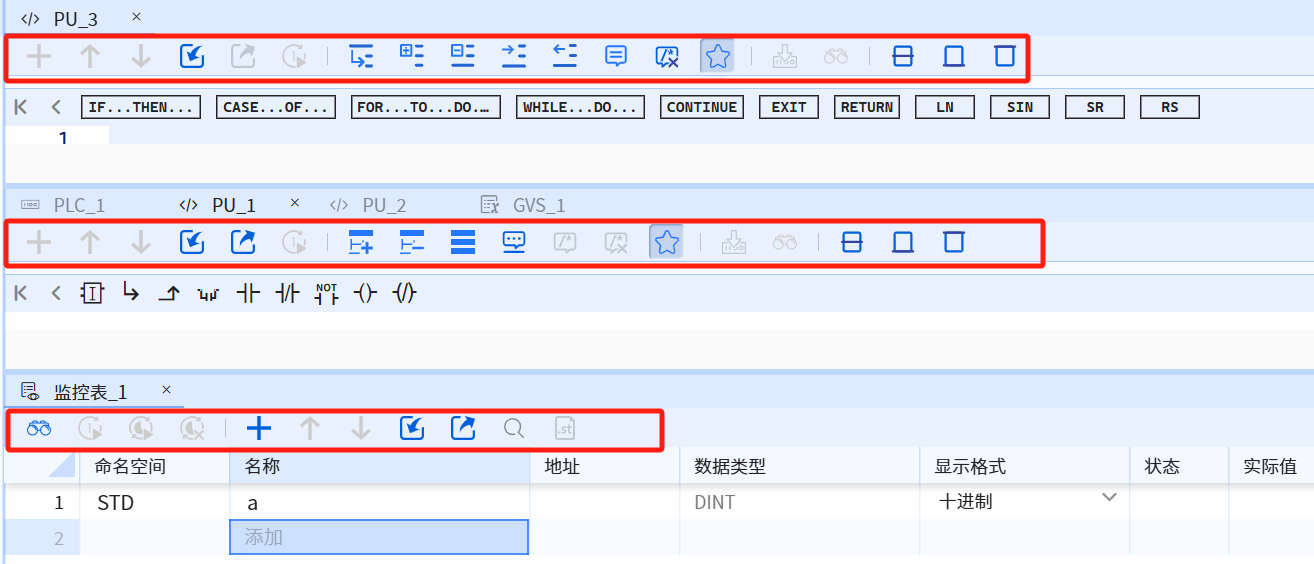
- The functions of each button are introduced in the following table
| Function | Icon | Function | Remarks |
|---|---|---|---|
| Add rows |  | Add rows in turn | |
| Add program segment |  | Add LD program segment | |
| Delete program segment |  | Delete LD program segment | |
| Move up |  | Move the selected line up | |
| Move down |  | Move the selected line down | |
| Refresh |  | Refresh the work area | |
| Import |  | Import the declaration form | |
| Export |  | Export the declaration form | |
| Write once |  | Write once when the value is modified online | |
| Continuous writing |  | Write continuously when the value is modified online | |
| Cancel continuous writing |  | Cancel the modified value after continuous writing | |
| Collect |  | Collect commonly used instructions. Click this icon to display the instructions in the editing area | |
| Monitor |   | Click to view the changes in variables after being online | |
| Start tracing |  | Start tracing related data | |
| Pause tracking |  | Stop tracking related data | |
| Clear curve |  | Clear curve | |
| Navigate to the specified row |  | Enter the number of row to navigate directly to the entered row | |
| Display program segment comments |  | Display comments in the work area | |
| Hide program segment comments |  | Hide LD program segment comment content | |
| Collapse all ST codes |  | Collapse collapsible code | |
| Expand all ST codes |  | Expand expandable codes | |
| Fold all LD codes |  | Fold all LD program segments | |
| Expand all LD codes |  | Expand all LD program segments | |
| Indent line |  | Indent the selected line or the line where the cursor is located | |
| Extend line |  | Unindent the selected line or the line where the cursor is located | |
| Comment the selected LD program segment |  | Comment the selected program segment | |
| Comment the selected ST line |  | Comment the selected line or the current line | |
| Cancel comment on the selected line |  | Cancel comment on the selected line or the current line | |
| Single module download | | Single module download | |
| Search |  | Project tree search | |
| Display editor by default |  | The work area displays both declaration area and code area | |
| Display all above the editor |  | Display the declaration area in the work area | |
| Display all below the editor |  | Display the code area in the work area |
|Generating Formulas| |Exporting TXT files|
|Find|
|Exporting TXT files|
|Find| |Finding the required variables|
1.2.3 Introduction to the buttons on the device configuration tab page
- The device configuration icon is located in the UI interface as shown in the following figure
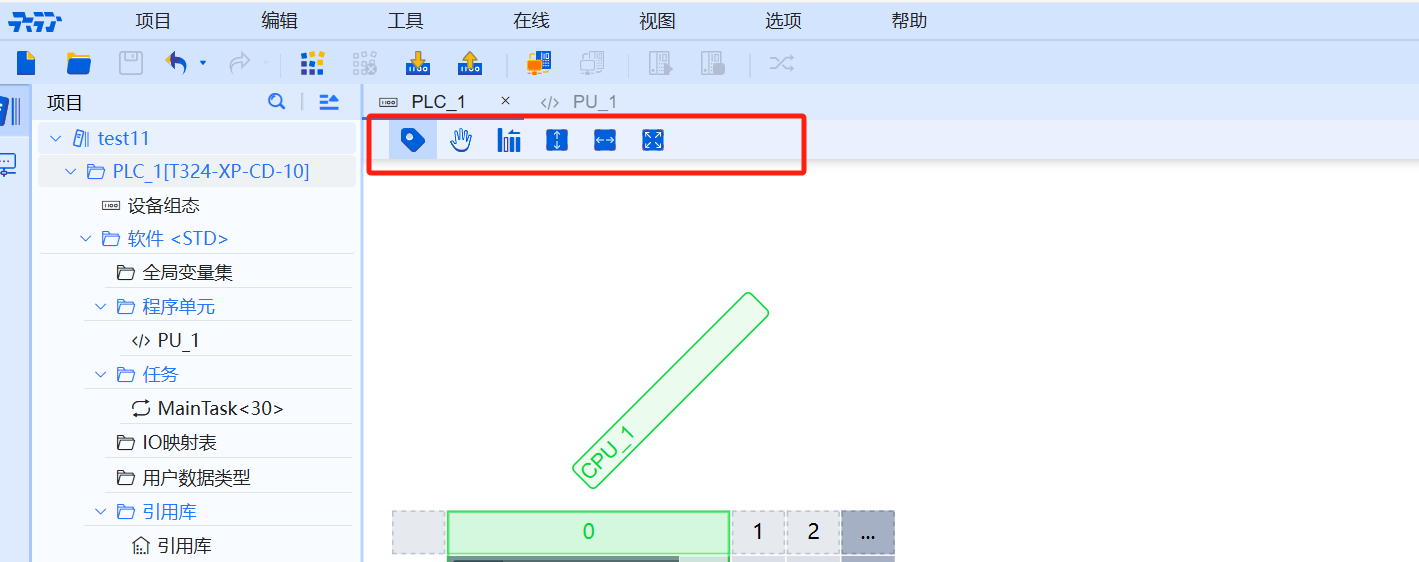
- The functions of each button are introduced in the following table
| Function | Icon | Function | Remarks |
|---|---|---|---|
| Tab |   | Click to display the label Click to cancel the display of the label | |
| Drag canvas |   | Click to move the entire configuration anywhere on the canvas Click to cancel moving the entire configuration anywhere | |
| Automatic arrangement |  | Automatically arrange all IO modules | |
| Height adaptive |  | Height adaptive | |
| Width adaptive |  | Width adaptive | |
| Window adaptive |  | Window adaptive |